 Facebook
 X
X
 Pinterest
 Copy Link
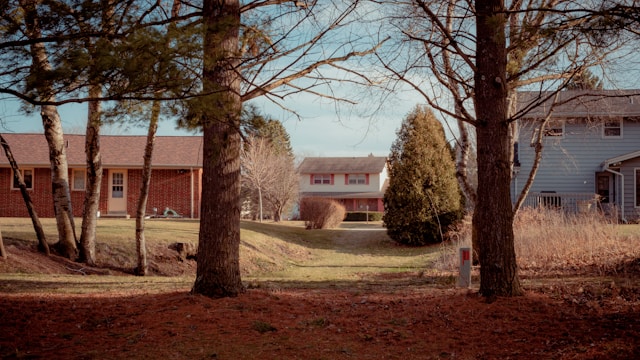
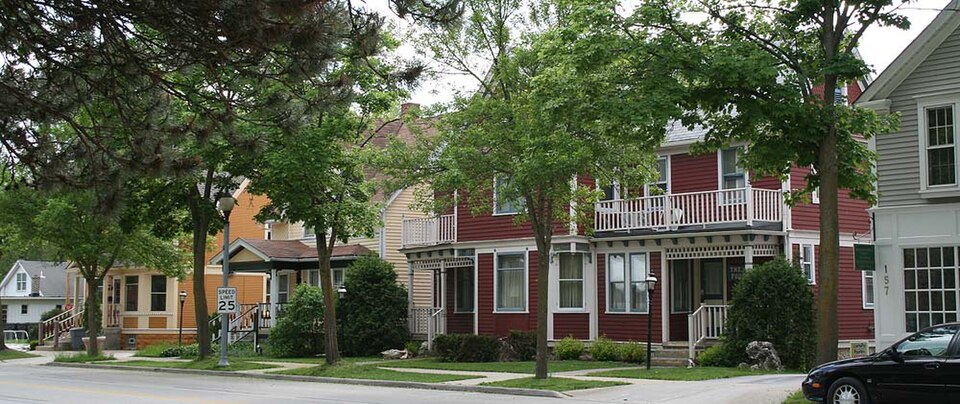
Photo: Suburban Wisconsin neighborhood
Published April 2, 2020
Captured with SONY ILCE-7R
Used under the Unsplash License
The Grafton housing market remained active through April. Buyer demand stayed steady, and pricing continued to hold strong across many parts of the market. Inventory is slowly improving, but conditions still favor sellers overall.
Year-to-date, the average list price in Grafton reached $661,925. The April average came in slightly lower at $646,403. Median list price figures showed a similar trend. The year-to-date median list price was $673,600, while the April median was $659,999.
Closed sales prices also remained strong during April. The average sales price rose to $591,761 for the month compared to the year-to-date average of $580,449. The median sales price increased to $618,750 in April. These numbers suggest buyers are still willing to compete for desirable homes in the area.
Homes continued to sell close to or above asking price. In April, sellers received an average of 101.17% of list price. This points to continued competition for well-maintained and properly priced homes. In addition, the average sales price per square foot increased to $264 in April, compared to the year-to-date average of $251.
Inventory levels improved slightly during the month. Grafton had 53 homes available for sale in April, along with 36 new listings entering the market. Month’s supply of inventory rose to 3.31 months. While this is an improvement, the market still remains below balanced conditions.
Homes spent an average of 99 days on market during April. However, market pace can vary depending on pricing, updates, and presentation. Homes that are clean, updated, and move-in ready continue to attract the strongest interest from buyers.
Home Flow Insight
As spring continues, outdoor presentation becomes more important. Buyers are paying closer attention to yards, patios, and outdoor gathering spaces this time of year. Fresh mulch, trimmed landscaping, swept walkways, and simple seating areas can help a property feel welcoming before buyers even step inside.
Small outdoor improvements can also help buyers picture themselves enjoying the home during the warmer months ahead.
Dillon Reed
Coldwell Banker Realty
Phone: ____________________
Email: ____________________
This April 2026 update reflects current housing trends in the Grafton, Wisconsin real estate market.